
SRI VIJAYA PURAM | OCTOBER 30, 2026 | DWEEP TULIKA | INVESTIGATIVE SERIES
THE HEADLINE PRIME MINISTER — PART 5 OF 7
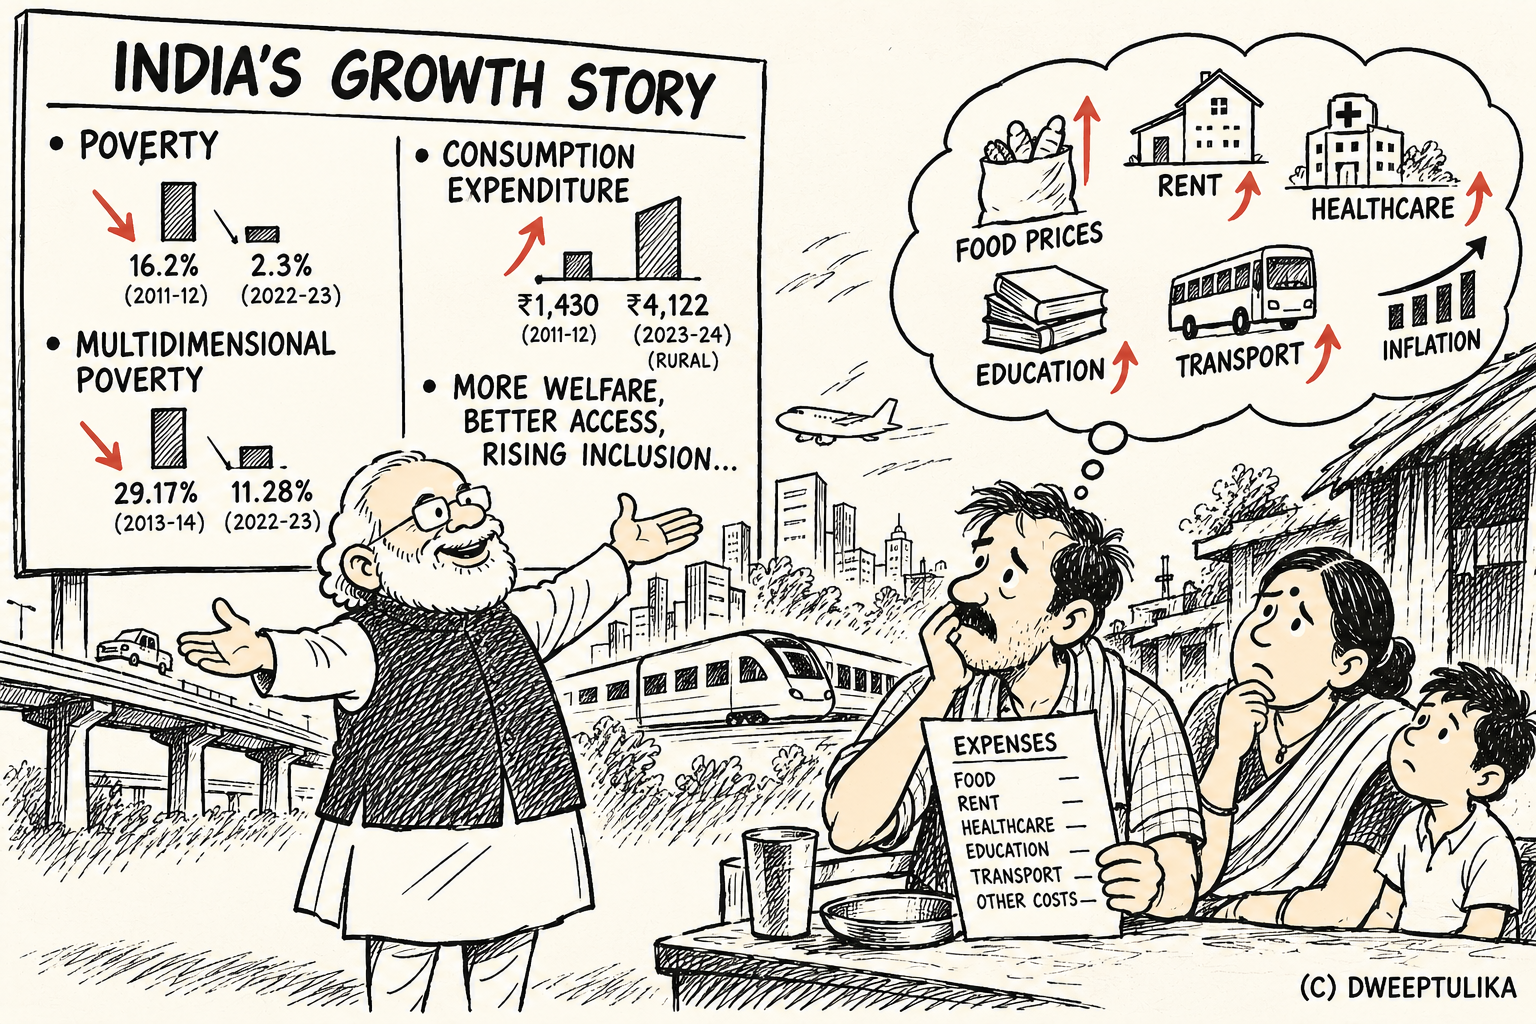
India's economic growth is frequently presented through expanding infrastructure, rising financial inclusion, welfare coverage and reductions in poverty. But national averages do not always reveal how far those gains reach individual households. A family may have moved above an official poverty threshold and still struggle with rent, food, healthcare, education, transport and other essential expenses.
The central question is not simply whether poverty has declined. It is whether households have gained enough financial security to withstand rising costs, whether the benefits of growth are distributed broadly, and whether the poorest sections are improving at the same pace as the rest of the population.
This fifth instalment of The Headline Prime Minister examines poverty estimates, household consumption, inequality and inflation, drawing on government surveys and independent assessments. The figures tell a more complex story than either a simple success narrative or a blanket claim of economic failure.
POVERTY: A SIGNIFICANT DECLINE, BUT WHICH MEASURE?
The government has cited substantial reductions in poverty over the past decade. The World Bank's revised estimates also indicate a sharp decline, although the scale depends on the poverty line and measurement method used.
In its June 2025 update, the World Bank revised India's historical poverty estimates using the 2022–23 Household Consumption Expenditure Survey and a modified mixed reference period. Under the former international extreme-poverty threshold of $2.15 per person per day, expressed in 2017 purchasing-power-parity terms, the estimated poverty rate fell from 16.2 per cent in 2011–12 to approximately 2.3 per cent in 2022–23.
However, the World Bank subsequently updated its global poverty lines to reflect 2021 purchasing-power parities. Under the revised extreme-poverty threshold of $3.00 per person per day, the estimated Indian poverty rate for 2022–23 was 5.3 per cent. Under the higher lower-middle-income-country threshold of $4.20 per person per day, it was 23.9 per cent.
These figures are not contradictory measurements of exactly the same threshold. They use different international poverty lines and purchasing-power-parity bases. The World Bank also revised the underlying historical series to improve comparability after changes in India's consumption-survey methodology.
The distinction matters. A person above the extreme-poverty line may still be living on an income or consumption level that leaves little room for unexpected medical costs, unemployment or price increases. Poverty measured at a higher threshold captures a much larger population facing economic vulnerability.
The World Bank's October 2025 India Poverty and Equity Brief estimated that the share of people below the $4.20 line declined from 57.7 per cent in 2011–12 to 23.9 per cent in 2022–23. It estimated extreme poverty under the revised $3.00 line at 5.3 per cent in 2022–23.
The figures indicate substantial progress, but they also show why the choice of poverty threshold changes the picture dramatically.
MULTIDIMENSIONAL POVERTY: PROGRESS BEYOND INCOME
Income or consumption is only one way of measuring deprivation. Multidimensional poverty considers disadvantages in areas such as nutrition, schooling, sanitation, drinking water, housing, electricity and access to essential services.
NITI Aayog's discussion paper, Multidimensional Poverty in India since 2005–06, estimated that multidimensional poverty declined from 29.17 per cent in 2013–14 to 11.28 per cent in 2022–23. It estimated that approximately 24.82 crore people moved out of multidimensional poverty during this period.
There is an important methodological qualification. The 2013–14 and 2022–23 figures are estimates derived by projecting the rate of decline between available National Family Health Survey observations. They are not direct annual survey measurements for those two years.
The National Multidimensional Poverty Index uses 12 indicators and the Alkire-Foster methodology. Its findings point to improvements in several basic living conditions. But an improvement in access to electricity, sanitation or schooling does not automatically establish that a household has adequate earnings, secure employment or sufficient savings.
The two measures answer different questions: multidimensional poverty assesses overlapping deprivations, while monetary poverty assesses whether consumption falls below a specified threshold.
WHAT HOUSEHOLDS ARE SPENDING
The Household Consumption Expenditure Survey (HCES) provides one of the most important official measures of household economic well-being.
According to the Ministry of Statistics and Programme Implementation, average monthly per capita consumption expenditure in 2023–24 was:
Rural India: ₹4,122
Urban India: ₹6,996
These figures exclude the imputed value of goods received free through social welfare programmes. When those items are included, the estimates rise to ₹4,247 in rural areas and ₹7,078 in urban areas.
The survey recorded an increase from ₹1,430 in rural India and ₹2,630 in urban India in 2011–12. These are nominal comparisons; they should not be read as equivalent increases in purchasing power without adjusting for inflation.
The urban-rural gap also narrowed. The difference in average monthly per capita consumption expenditure was approximately 84 per cent in 2011–12, 71 per cent in 2022–23 and 70 per cent in 2023–24.
This is a positive trend, but the national average conceals substantial differences between states and household groups.
For example, in 2023–24, average monthly per capita expenditure was ₹3,357 in rural Odisha and ₹5,825 in urban Odisha. In Bihar, it was ₹3,670 in rural areas and ₹5,080 in urban areas. Kerala recorded ₹6,611 in rural areas and ₹7,783 in urban areas.
The survey also found differences across social groups. Average monthly per capita expenditure in rural India was ₹3,363 for Scheduled Tribe households, ₹3,878 for Scheduled Caste households, ₹4,206 for Other Backward Classes and ₹4,642 for the 'Others' category. In urban India, the corresponding figures were ₹6,030, ₹5,775, ₹6,738 and ₹7,832.
These are averages, not measures of every household's circumstances. They nevertheless demonstrate that consumption levels differ across social and geographical groups.
THE INEQUALITY QUESTION: WHAT DOES THE GINI COEFFICIENT SHOW?
The government's HCES findings report a decline in consumption inequality.
The Gini coefficient, a statistical measure of inequality in which a lower value indicates a more equal distribution, fell between 2022–23 and 2023–24:
Rural India: 0.266 to 0.237
Urban India: 0.314 to 0.284
The 2023–24 figures were also lower than the corresponding 2011–12 estimates of 0.283 in rural areas and 0.363 in urban areas.
This is relevant evidence and should not be ignored. It suggests that the distribution of measured household consumption became more equal in the survey period.
But consumption inequality is not the same as income inequality or wealth inequality. A consumption survey measures what households spend; it does not fully capture the distribution of land, property, financial assets, business ownership or accumulated wealth.
A lower consumption Gini therefore does not, by itself, establish that India's overall wealth gap has narrowed. Nor does a national figure show whether the richest households have accumulated wealth much faster than the poorest.
The correct conclusion is narrower: official household consumption data show a decline in measured consumption inequality between the reported survey rounds. Broader claims about income and wealth distribution require separate evidence.
THE COST OF LIVING: INFLATION IS NOT JUST A NUMBER
For households, economic improvement is experienced through the prices of everyday essentials.
Food, rent, transport, cooking fuel, healthcare and education compete for the same household budget. Even when inflation slows, prices do not necessarily return to earlier levels. A lower inflation rate means prices are rising more slowly, not that the previous increase has been reversed.
The latest available official Consumer Price Index release at the time of publication is for September 2026. The Ministry of Statistics and Programme Implementation reported year-on-year retail inflation of 5.54 per cent, while food inflation was 7.74 per cent.
The rural retail inflation rate was 6.08 per cent, compared with 4.88 per cent in urban areas. Rural food inflation stood at 8.06 per cent and urban food inflation at 7.18 per cent.
The figures are particularly relevant because food accounts for a substantial share of household consumption. In HCES 2023–24, food represented approximately 47 per cent of rural monthly per capita expenditure and 40 per cent of urban expenditure.
A rise in food prices can therefore place disproportionate pressure on households with limited disposable income. A household with a larger share of its budget committed to food has less flexibility to absorb price increases in other essential areas.
The CPI series has also moved to a new base year of 2024=100. Comparisons with older inflation series should take account of the change in the statistical base and updated consumption weights.
WHO FEELS THE PRESSURE MOST?
The impact of inflation is not uniform. A salaried household with stable income, savings and access to formal credit may absorb higher prices differently from a casual worker whose earnings fluctuate from week to week.
The HCES 2023–24 data show that average monthly per capita expenditure among rural casual labour households was ₹3,652 for agricultural work and ₹3,653 for non-agricultural work. Rural households dependent on regular non-agricultural wages or salaries recorded a higher average of ₹5,005.
In urban India, average monthly per capita expenditure was ₹4,964 among casual labour households and ₹7,606 among regular wage or salaried households.
These differences do not prove that every casual worker is poor or that every salaried household is financially secure. They do indicate that the economic position of households is closely connected to the nature and stability of their work.
The previous instalment of this series examined employment quality, wages and the large share of self-employment in India's workforce. This instalment adds another dimension: the amount households can actually consume after meeting their essential expenses.
WELFARE SUPPORT AND THE LIMITS OF AVERAGE FIGURES
Free food grains, subsidised services, housing assistance, health coverage and direct transfers can reduce the burden on low-income households. The World Bank has also recognised the contribution of social transfers, including subsidised food, to poverty reduction in India.
The HCES itself reports consumption estimates both with and without the imputed value of goods received free through welfare programmes. This distinction is important because household welfare may improve through public support even when cash income does not rise by the same amount.
However, a benefit's announced coverage is not identical to its actual impact. The value of a welfare programme depends on whether eligible households are reached, whether support arrives regularly, whether the service is functional and whether the assistance is sufficient in relation to household needs.
A free food entitlement may reduce food expenditure, but it does not pay a family's rent, transport costs, school expenses or medical bills. Health insurance coverage may protect a household from certain hospital expenses, but it does not eliminate every out-of-pocket healthcare cost.
Welfare schemes can make a measurable difference. Their existence should be acknowledged, but their coverage figures should not be mistaken for a complete measure of economic security.
THE VERDICT: POVERTY HAS DECLINED, BUT THE ECONOMIC SECURITY QUESTION REMAINS
The evidence examined in this instalment supports several conclusions.
India has recorded a substantial reduction in poverty under multiple official and international measures. NITI Aayog's multidimensional poverty estimates indicate improvements in access to basic services. Household consumption expenditure has increased, the urban-rural consumption gap has narrowed, and the official HCES data show a decline in measured consumption inequality.
These are meaningful developments and deserve recognition.
At the same time, the choice of poverty threshold changes the number of people classified as poor. Millions remain below the World Bank's higher $4.20-a-day lower-middle-income poverty line. Average consumption differs significantly across states, social groups and household employment categories. And the September 2026 inflation figures show that food prices continue to rise faster than the overall retail price index.
The evidence does not justify declaring that poverty reduction has been insignificant. It also does not justify treating a decline in extreme poverty as proof that economic hardship has disappeared.
The more useful test of development is whether households can afford adequate food, housing, education, healthcare and transport without being pushed into debt by an unexpected expense.
For the government, the challenge is no longer only to demonstrate how many people have crossed a poverty threshold. It is to show how many have achieved durable economic security.
The next question is how public money is allocated, spent and audited. In Part 6, this series will examine government expenditure, budget promises, implementation gaps and the findings of the Comptroller and Auditor General.
EDITORIAL NOTE: Poverty estimates in this report use different thresholds and methodologies and are identified separately. World Bank estimates based on the $2.15 line (2017 PPP), $3.00 line (2021 PPP) and $4.20 line (2021 PPP) are not directly interchangeable. NITI Aayog's 2013–14 and 2022–23 multidimensional poverty figures are estimates, not direct annual survey observations. HCES figures are average monthly per capita consumption expenditure, not household income. CPI inflation figures refer to September 2026, the latest available release at the time of publication.